AI Images in B2B Marketing: Why Engineers Notice, and What Technical Brands Use Instead
Engineers spot imprecise AI images in B2B marketing at a glance. Where generated visuals fail technical content, and the exact alternative for technical brands.

Key takeaways
- An engineering audience reads pictures the way it reads drawings: it counts teeth, checks units and looks for the version number. Generated visuals tend to fail exactly there.
- For a technical brand an imprecise picture is not a small flaw. It contradicts the precise product it is meant to sell, and a correct generated picture earns no extra credit.
- AI images have a place in B2B tech marketing, for moods, textures and drafts that nobody would measure. The product, the figures, the labels, the interface and the logo should be drawn, not generated.
- Technical companies already publish exact material: changelogs, data sheets, test results and fair dates. Designed templates turn it into short video without inventing a single detail.
AI images in B2B marketing have a particular problem when the buyer is an engineer. A generated picture of a gearbox can look convincing for a moment, and a moment is about how long it takes somebody who designs gearboxes to start counting the teeth. Technical audiences do not look at pictures the way a general audience does. They read them.
This is not an argument against AI. It is about one audience and one kind of content: technical buyers looking at pictures of technical things, and why technical brands are better off keeping generated visuals away from anything that can be checked.
Why do engineers notice AI images so quickly?
Because checking is the job. An engineer looking at a drawing counts teeth, follows a trace, reads a tolerance and looks for the unit. Looking at a screenshot, they read the version number. Looking at a chart, they look for the axis before the line. That habit does not switch off on social media.
Technical publishing shows how seriously a technical audience takes the provenance of a figure. IEEE’s author guidelines, checked on 14 October 2026, require content generated by AI in an article, text, figures, images and code alike, to be disclosed in the acknowledgments, and say: “The AI system used shall be identified.” Help with editing and grammar is generally outside that rule.
Readers do catch what slips through, even outside engineering. In February 2024 a life-science journal, Frontiers in Cell and Developmental Biology, published a review on 13 February and retracted it on 16 February, after “concerns were raised regarding the nature of its AI-generated figures”. As Popular Science reported the same day, the labels in those figures were not words. One case in another field proves nothing about engineers in particular. The argument of this article is reasoning from how technical people work, not a measured finding, but the case shows how quickly trained readers can find a figure that does not hold up, and share it.
Where do generated visuals fail technical content?
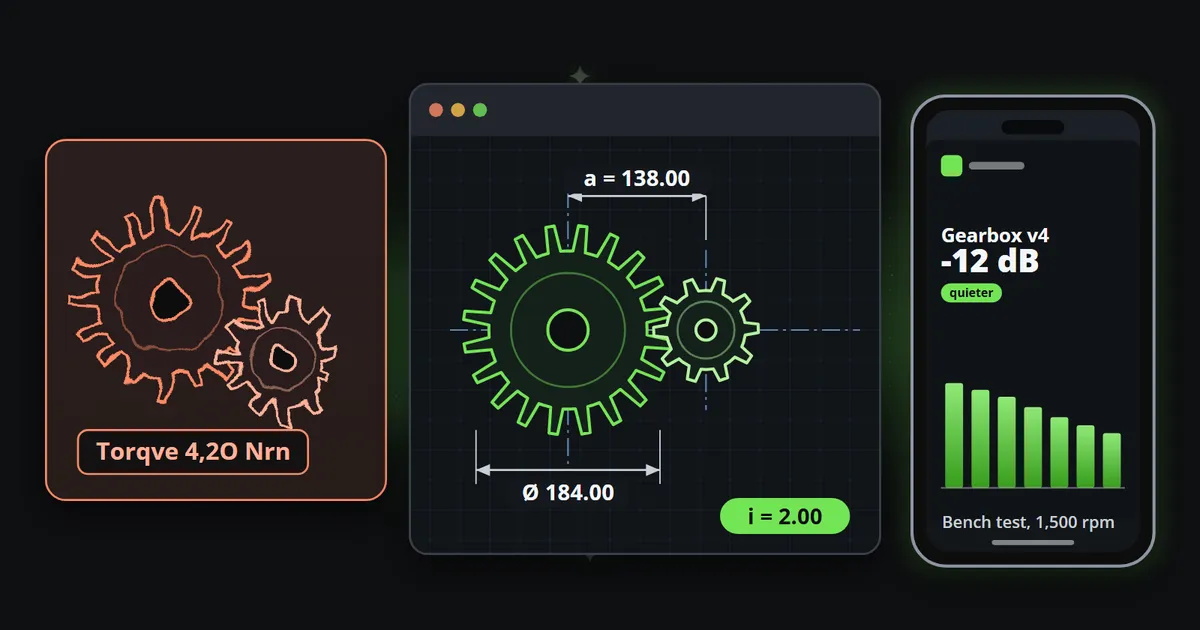
Image and video models are remarkable at mood, light and texture. What they produce is what looks plausible, not what a specification says, and the details that make a technical picture correct are exactly the details that only have to look plausible to pass at a glance. As of October 2026, these are the ones many tools still approximate:
| What the picture shows | What many tools still approximate | What an engineer sees |
|---|---|---|
| Gears and mechanisms | Tooth counts, meshing, joints | A machine that could not turn |
| Threads and fasteners | Pitch that changes along the thread, heads with the wrong number of sides | A part nobody could make |
| Connectors and boards | Pin counts and spacing, traces that end nowhere | A board that would not work |
| Interfaces and screenshots | Text that is nearly words, controls that do nothing | Not your product |
| Labels, units and figures | 4,2O instead of 4.20, Nrn instead of Nm | A number nobody can trust |
| Charts | Curves without axis, unit or scale | Decoration pretending to be data |
| Your logo | Proportions, spacing and colour that drift | Not your company |
The left half of the next picture is drawn by hand to illustrate failures that are common in generated pictures; it is not the output of any particular model.
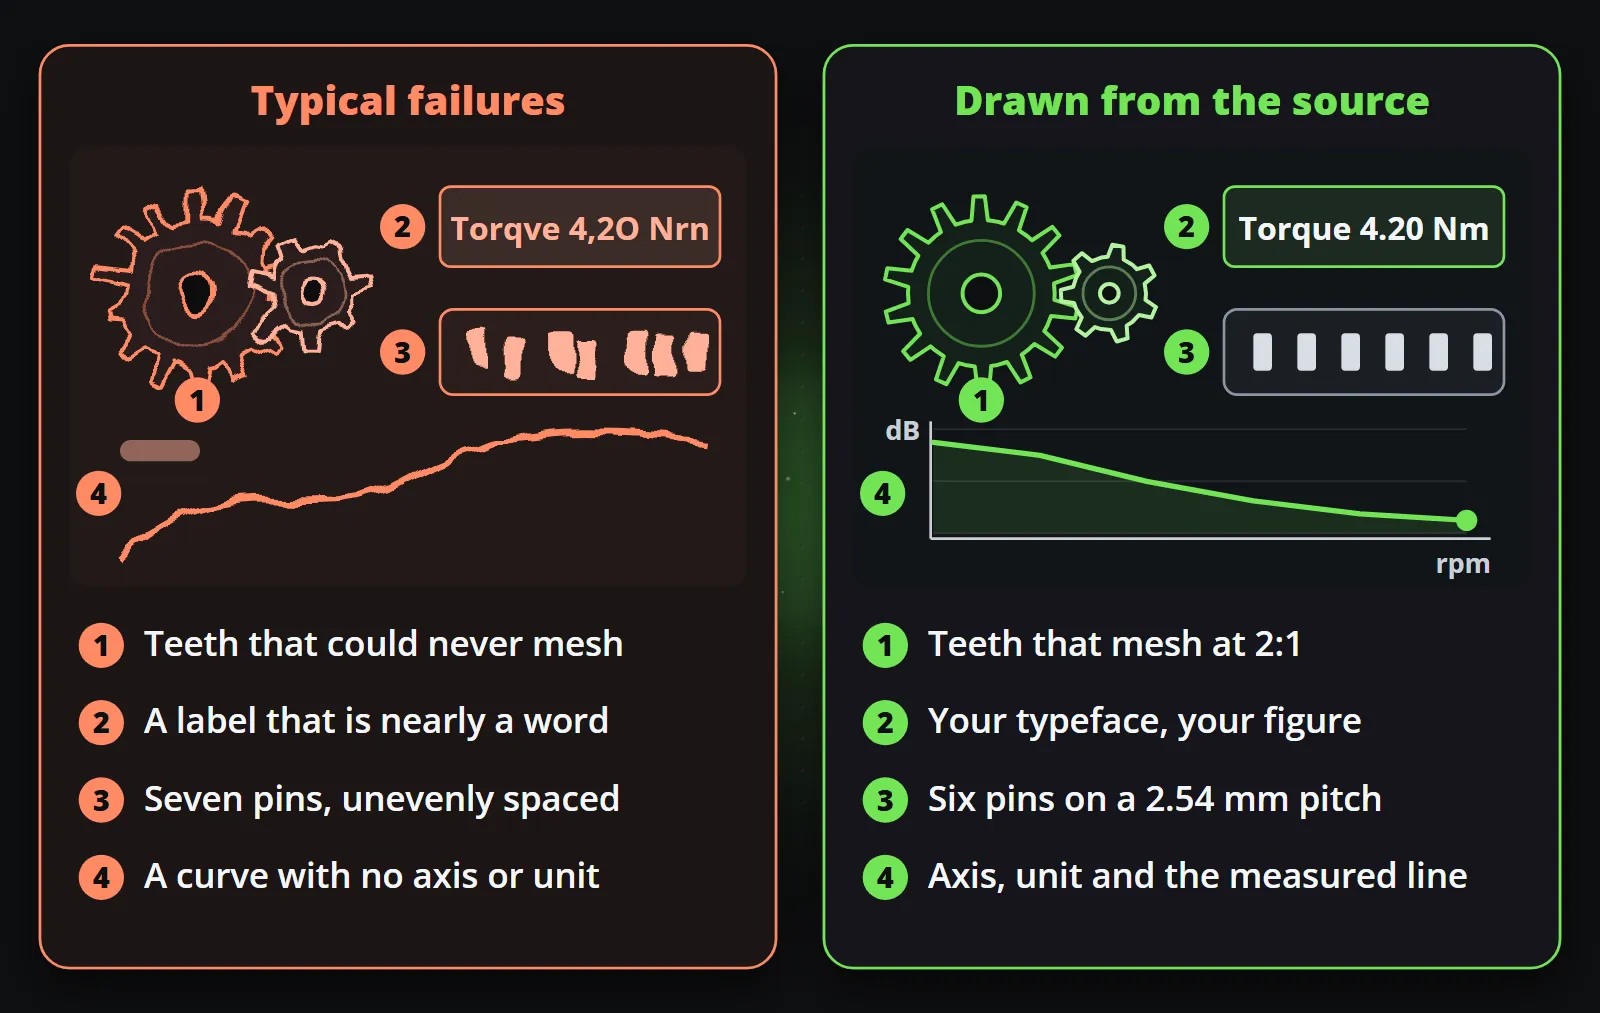
None of these is a rare failure in today’s tools. They follow from how the pictures are made, which What generative video still cannot do explains in detail: text is drawn rather than set, every frame is approximated from its neighbours, and the model has no data, only examples.
Why does an imprecise picture cost a technical brand more?
For most brands a slightly wrong picture is a slightly worse picture. For a technical brand it is a contradiction. The product is sold on being exact: tolerances, ratings, test results, compatibility. A picture that is not exact says the opposite of the product, in the one place every prospect looks first.
The risk is also lopsided. A generated picture that happens to be right earns no extra credit, because a correct picture is simply what was expected. A wrong one invites the question nobody in sales wants asked: if they got the picture wrong, what about the data sheet? And a screenshot of a mangled diagram travels further in an engineering forum than the original post ever did.
There is a cost on the inside as well. Every generated technical picture has to be checked by somebody who knows what correct looks like, detail by detail. That person is usually the most expensive one in the building, and the check has to be repeated for every new picture.
Where do AI images fit in B2B tech marketing?
Generated pictures and AI tools still earn their place in a technical marketing team, as long as they stay away from anything a reader could count, measure or compare with the real thing:
- Moods and concepts. Early ideas for a campaign, a stand design or a look, where everybody knows the picture is a sketch.
- Abstract backgrounds and textures. A gradient, a field of light or a pattern behind a drawn figure, made once, checked once and reused.
- Drafting text. A first version of a caption or a post, which a person who knows the product then corrects.
- Running the channel. An assistant that picks what to post and schedules it, while the visuals come from templates.
Reelwire’s own AI assistant works on that side of the line: with your own keys from the services you choose, it can make a background, a soundtrack or a draft text, and a template draws the product’s figures, labels and logo over it. Where a generated element would be realistic enough to mislead, label it as your platform and your rules ask.
Precision as part of the brand
A technical brand’s look is more than colours. It is the typeface its data sheets are set in, the way it writes units, the exact logo file and the geometry of its products. A clip that keeps all of those is recognisably the same company as the manual and the website.
Shape matters too. A technical graphic cannot be cropped into another aspect ratio without losing the part that carries the information: cut a wide chart into a tall phone frame and the axis, the unit and half the title go first. Composed for each shape from one template, nothing is lost.
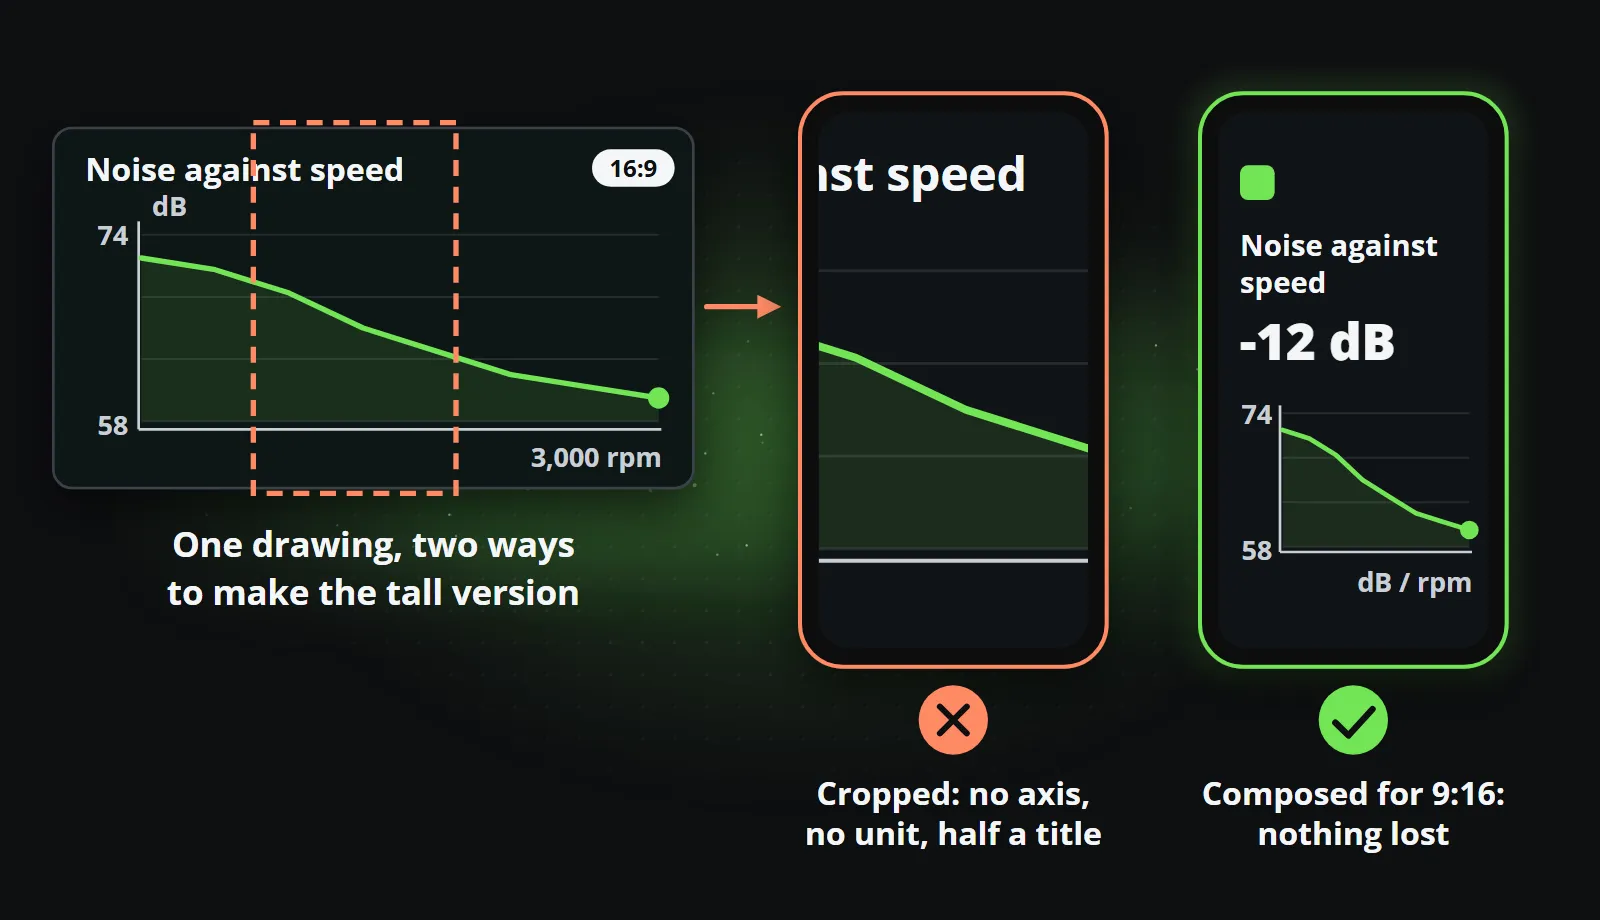
One composition, every aspect ratio explains how a single template is laid out for every shape, and the same applies to language: a clip in every language you sell in, each drawn in its own script, is a setting rather than a translation project.
What should a technical brand automate instead?
The exact material already exists. Technical companies already publish a lot of checked, approved facts: release notes, specifications, test results, certifications, event dates. It is written, reviewed and public, and it reaches the few people who visit the page it sits on. What is missing is not content but the short video that carries it to the feeds where buyers spend their time.
| What you already publish | Format | What the clip shows |
|---|---|---|
| Release notes and changelog | Updates log | The version, the changes that matter, the date |
| Data sheet | Table | The specifications, exactly as published |
| Test report or benchmark | Line chart or big number | The measured value, with axis and unit |
| Certification | Text card | What was certified and when |
| Trade fair dates | Countdown | Days to go, hall and stand |
| Product history | Timeline | The versions and their dates |
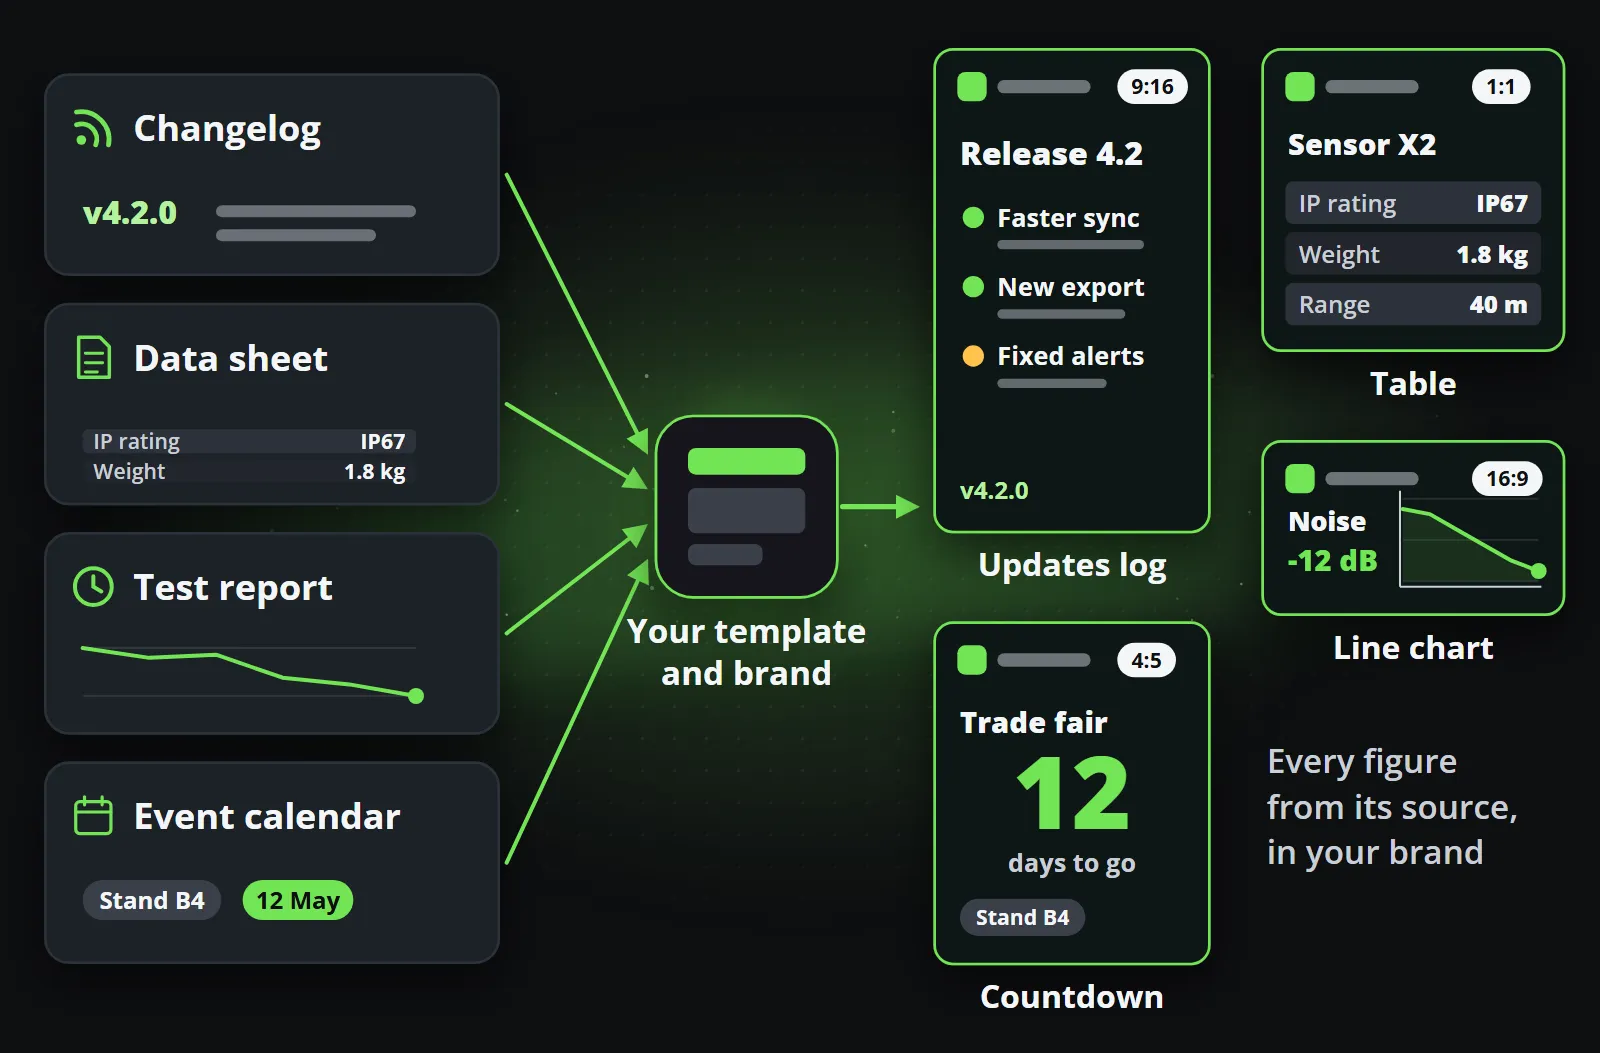
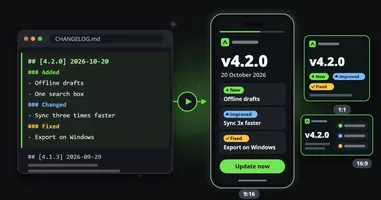
In Reelwire, each of these is a designed template filled from data. A ready-made format such as an updates log, a table, a line chart or a countdown, or a template designed around your own brand, takes the figures from where they already live: a post list for the items somebody writes in advance, or your own system sending each release as an event over the API, with code examples in Node.js, Python, PHP, C# and curl. Every field has a limit, so an over-long product name is refused by name rather than clipped on a published clip, and a reviewer approves a template version once, so every clip made from it inherits that approval. Release notes to video walks through the most common case, the changelog.
A checklist before a technical visual goes out
- Could an engineer count anything in it? Then count it yourself first.
- Is every figure from a source you can name? If not, it does not go out.
- Are units, separators and symbols right? 4.20 Nm, not 4,2O Nrn.
- Is it your logo file, not a likeness of it?
- Is any interface shown your real interface, in its current version?
- Does every chart have an axis, a unit and the real values?
- Does it survive the tall format with nothing important cropped away?
- If any part is generated, is it something nobody would measure, and is it disclosed where your rules or the platform ask?
Bottom line
An engineering audience forgives a plain picture and does not forgive a wrong one. Generated visuals are good at the parts of a picture nobody measures and weak at the parts an engineer checks first, so the sensible split is simple: generate the mood if you like, and draw the product, the figures, the labels and the logo from the source.
The offer on Reelwire’s page for tech and industry is the quickest way to see it on your own material: send the address of your news page, and a week of your channel comes back, built from what is already on it (send your news page). The free plan makes 25 videos a month with no card.
Frequently asked questions
Should B2B tech companies use AI images in their marketing?
For moods, abstract backgrounds, textures and early concepts, often yes. For anything an engineer could measure or check, such as the product, its figures, labels, interface or logo, generated pictures are a risk, because current models tend to approximate exactly those details.
Why do AI images get technical details wrong?
An image model produces what looks plausible, from patterns learnt in training, rather than drawing from a specification. Counts, spacing, lettering and units have no special status in that process, so teeth that cannot mesh, pins that are unevenly spaced and labels that are nearly words are common.
Do engineering publications require AI-generated figures to be disclosed?
IEEE does: its author guidelines, checked on 14 October 2026, say content generated by AI in an article, including text, figures, images and code, must be disclosed in the acknowledgments, naming the AI system used. Editing and grammar help is generally outside that policy.
What should a technical brand automate instead of generating images?
The material it already publishes: release notes, data sheets, test results, certifications and trade fair dates. Designed templates turn each into a short clip, an updates log, a table, a line chart or a countdown, with every figure taken from the source.
Can AI still help a technical marketing team?
Yes: for drafting text that a person checks, for choosing what to post, for backgrounds and soundtracks, and for running the channel through an assistant. The line is simple: keep generators away from anything a reader could count, measure or compare with the real product.

Co-founder of Reelwire. Every organisation has facts worth showing, its prices, results, releases and warnings, and the vision is that every one of them can show those facts every day, on brand, in every format and language, without a production team behind each post. Your data, in motion: correct, recognisable and consistent from the first clip to the thousandth.