10 Local Government Social Media Ideas From Data the City Already Holds
Weather warnings, bin days, roadworks, river levels: ten daily local government social media ideas, each with the official source its data comes from.

Key takeaways
- Most of what residents need from their city every day already exists as data: warnings, collection calendars, closures, gauge readings, timetables and council decisions.
- Each of the ten formats has an official source to name in the clip, from the Deutscher Wetterdienst's warnings to the federal waterway gauges.
- Some formats serve residents today, others make the account worth following on a quiet day. A city channel needs both, and nearly all of them can be made from data automatically.
- Start with one department and one format, approve the template once, and add the next department when the first one runs.
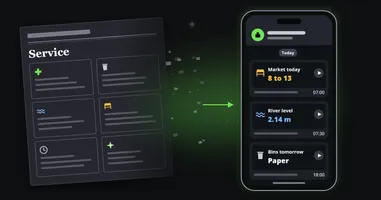
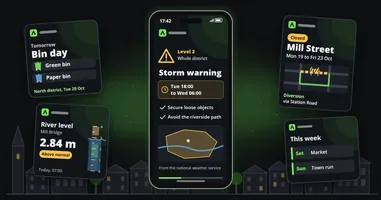
Most cities already know they should post more than they do. The harder question is what to post on a Tuesday when nothing is happening. This article is a practical answer: ten local government social media ideas that work every day, each built on data the city or an official source already publishes, each with an example of the clip it makes.
Why the daily posts matter at all is covered in municipal social media: the channel has to exist before the emergency. In short: a warning reaches whoever already follows the account, and routine, useful posts are what build that following. Here the question is which routine posts, and where their data lives.
What makes a good daily format for a city?
A format earns a place on the channel when it passes three tests:
- The data exists and updates itself. Somebody already keeps it, for a reason that has nothing to do with social media. Nobody has to type it twice.
- Residents use it. It answers a question people actually have: is my bin going out, is the road open, is the river rising.
- It fits in a few seconds without sound. One figure, one date, one place, one thing to do. A short video read on a phone in a bus.
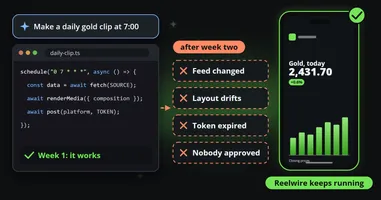
Formats that pass all three can be made automatically: a template designed once in the city’s look, filled by the data each time it changes. Data to video explains how the data reaches the template.
Ten local government social media ideas, with their sources
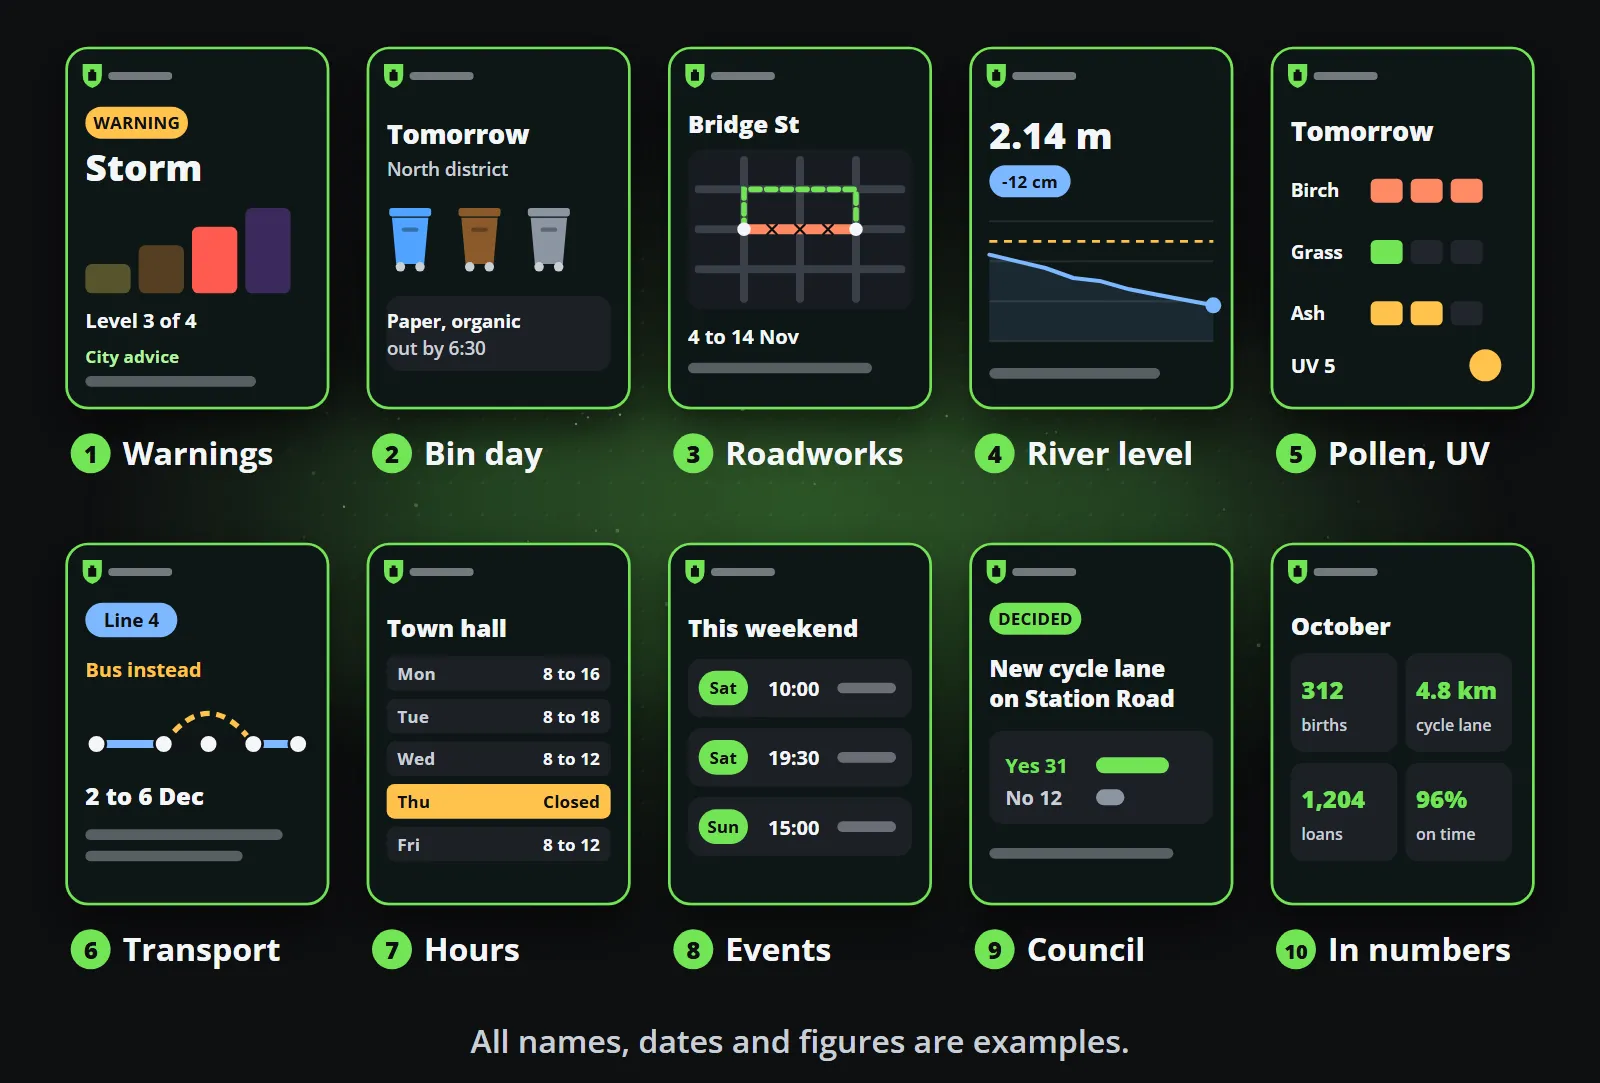
1. Weather warnings
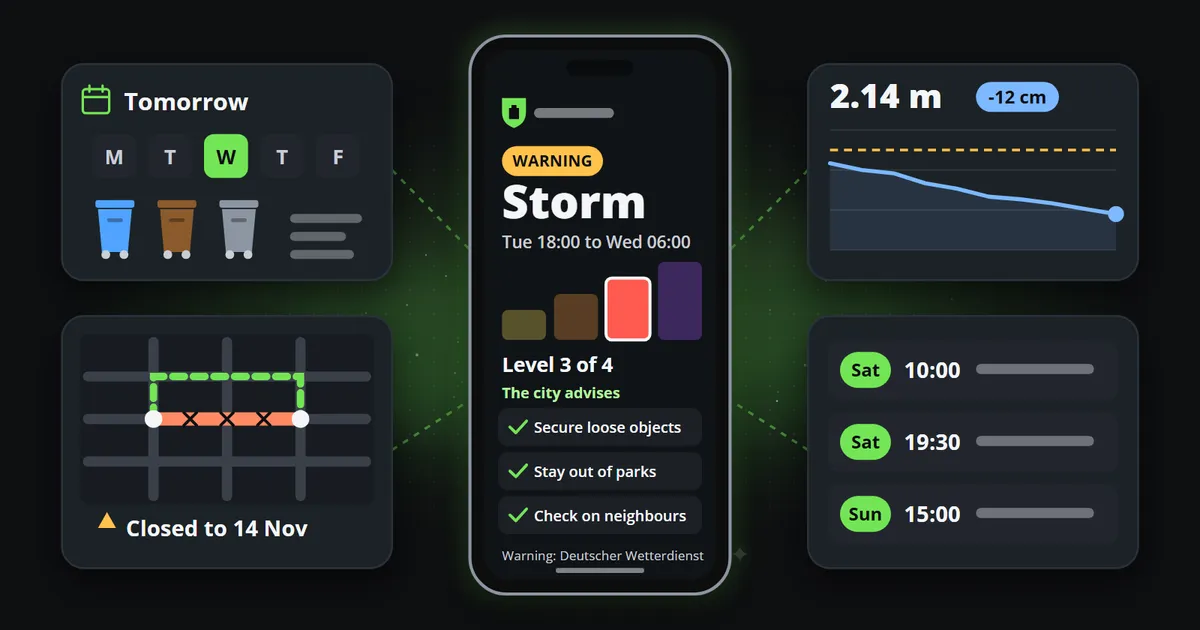
The clip: “Storm, level 3 of 4, Tuesday 18:00 to Wednesday 06:00”, with three things to do, in the city’s own words.
The source: In Germany, the Deutscher Wetterdienst (DWD) issues official warnings in four levels, from yellow to purple (the DWD’s warning levels, checked on 14 October 2026), and publishes them as open data. Reelwire’s ready-made feed shows the DWD’s severe and extreme warnings, red and purple only, for the whole of Germany, grouped by state. A warning for the city’s own area, with the city’s own advice on what to do, is a job for a custom feed: the city’s system sends the warning for its district with its own wording, and the clip follows.
The official warning apps stay the alarm: NINA, run by the Federal Office of Civil Protection and Disaster Assistance, carries the DWD’s warnings and flood information (the BBK on NINA, checked on 14 October 2026). The city’s post adds reach and local advice; it does not replace them.
2. Bin day
The clip: “Tomorrow in the north district: paper and organic, out by 6:30”, with the bins drawn.
The source: The collection calendar the waste service already keeps per street or district to plan its rounds. Posted the evening before, one clip per district due, it can be one of the most useful posts a city makes, and it repeats every week.
3. Roadworks and closures
The clip: “Bridge Street closed from 4 to 14 November”, with the closed section and its diversion drawn on a map.
The source: The roads office’s register of closures. In Germany, road authorities can also publish closures and roadworks to the Mobilithek, the national access point for mobility data. Reelwire’s Public bodies package has a roadworks template that draws the closed section, the diversion, how far the works have got and the advice for drivers.
4. River level
The clip: “2.14 metres, 12 centimetres lower than yesterday”, over a line of the past days with the warning level marked.
The source: For the federal waterways, PEGELONLINE, run by the Federal Waterways and Shipping Administration, offers current gauge readings through free web services (checked on 14 October 2026). It labels them as raw data, not yet checked, which the clip’s source line can say too. For smaller rivers, the federal states’ flood centres publish together at hochwasserzentralen.de. A ready-made feed carries eight Rhine gauges every morning.
5. Pollen, UV and air
The clip: “Tomorrow: birch high, grass low”, or today’s UV index with its band from low to extreme.
The source: The DWD’s pollen danger index covers eight pollen types, from hazel and alder to grasses and ragweed, and is published as open data; the DWD also forecasts the UV index. Air quality readings come from the German Environment Agency. Ready-made feeds carry the pollen forecast and the UV index.
6. Public transport changes
The clip: “Line 4: buses instead between Market Square and the station, 2 to 6 December”.
The source: The transport operator: its disruption notices and its timetable data, often published in the GTFS format that journey planners read.
7. Opening hours and holiday closures
The clip: “Town hall: closed on Thursday”, with the week’s hours in a table.
The source: The city’s own schedules, plus the dates that change them: public holidays by state, and school holidays, whose dates for all sixteen German states the Standing Conference of the Ministers of Education publishes in one place. Ready-made feeds count down to the next public holiday and the next school holidays.
8. Events this week
The clip: “This weekend”: the market on Saturday at 10:00, the concert at 19:30, the open day on Sunday.
The source: The city’s events calendar, kept by the culture or tourism office for the website anyway. Posted on Monday for the week and on Thursday for the weekend.
9. Council decisions
The clip: “Decided: a new cycle lane on Station Road”, with the vote, and a link to the minutes.
The source: The council information system, where agendas, minutes and decisions are published. Some expose their data through OParl, an initiative to standardise open access to parliamentary information systems in Germany. The same channel can announce consultations: the question, the options and the deadline to take part.
10. The city in numbers
The clip: “October: 312 births, 4.8 km of new cycle lane, 1,204 library loans a day”.
The source: The city’s own counts and the statistics offices of the federal state and of Destatis. Once a month, figures that make the city visible: what was built, repaired, lent, registered or answered.
Where does each format’s data live?
| Format | Where the data usually lives | Rhythm | Serves or builds |
|---|---|---|---|
| Weather warnings | The national weather service (the DWD in Germany) | As issued | Serves |
| Bin day | The waste service’s collection calendar | Evening before, per district | Serves |
| Roadworks | The roads office’s closures register | Day before, and weekly | Serves |
| River level | Federal gauges (PEGELONLINE) and state flood centres | Daily, and when it rises | Both |
| Pollen, UV, air | The DWD and the German Environment Agency | Daily in season | Builds |
| Transport changes | The transport operator | As announced | Serves |
| Opening hours | The city’s schedules, holiday calendars | Before each change | Serves |
| Events | The city’s events calendar | Monday and Thursday | Builds |
| Council decisions | The council information system | After each meeting | Builds |
| The city in numbers | The city’s records, statistics offices | Monthly | Builds |
Every row is one template, designed once in the city’s colours, typeface and logo, in every aspect ratio the city publishes. A headline that does not fit is refused by name rather than squeezed, so nothing half-cut is ever published.
Which formats build the audience, which serve it?
The table’s last column is the important one. Serving formats answer a question residents have today: is my bin going out, is the road open, which bus do I take. They can bring people back. Building formats are worth seeing on a day when nothing is wrong: the weekend’s events, the pollen forecast, what the council decided, the city in figures. They can be the reason somebody follows the account in the first place, and shares it.
A channel of serving formats alone reads like a noticeboard. A channel of building formats alone looks like marketing. Mixed, a week looks like this:
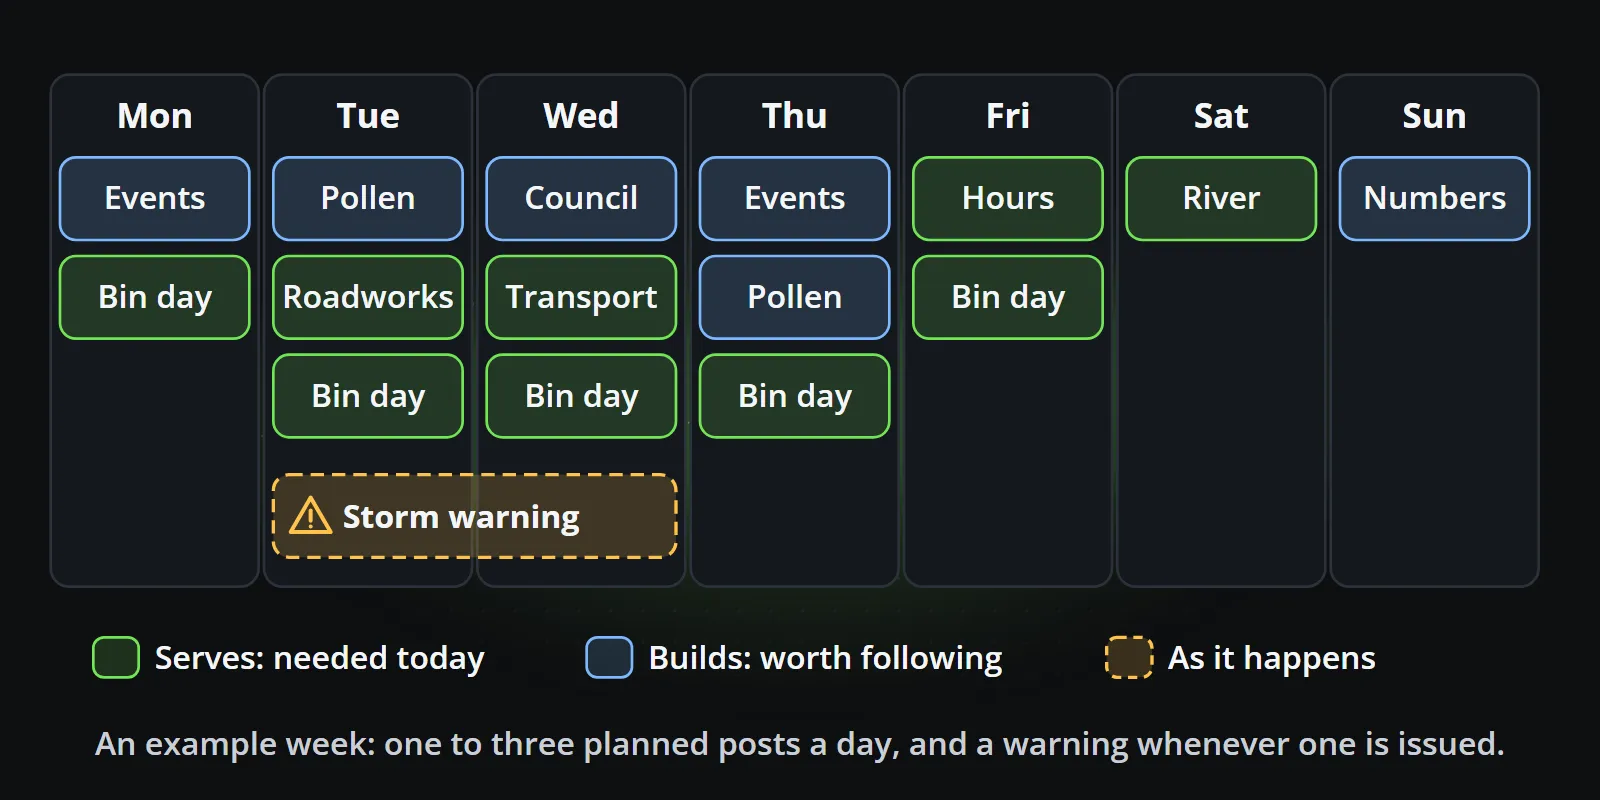
Nearly all of that week is made from data and needs nobody to open an editor. The warning goes out the moment it is issued, and the rest follows its own rhythm: a ready-made feed can be released as it arrives, after a set delay, on chosen days and times or once a month, and a post written in advance goes out at the time it was written for.
How do you start with one department?
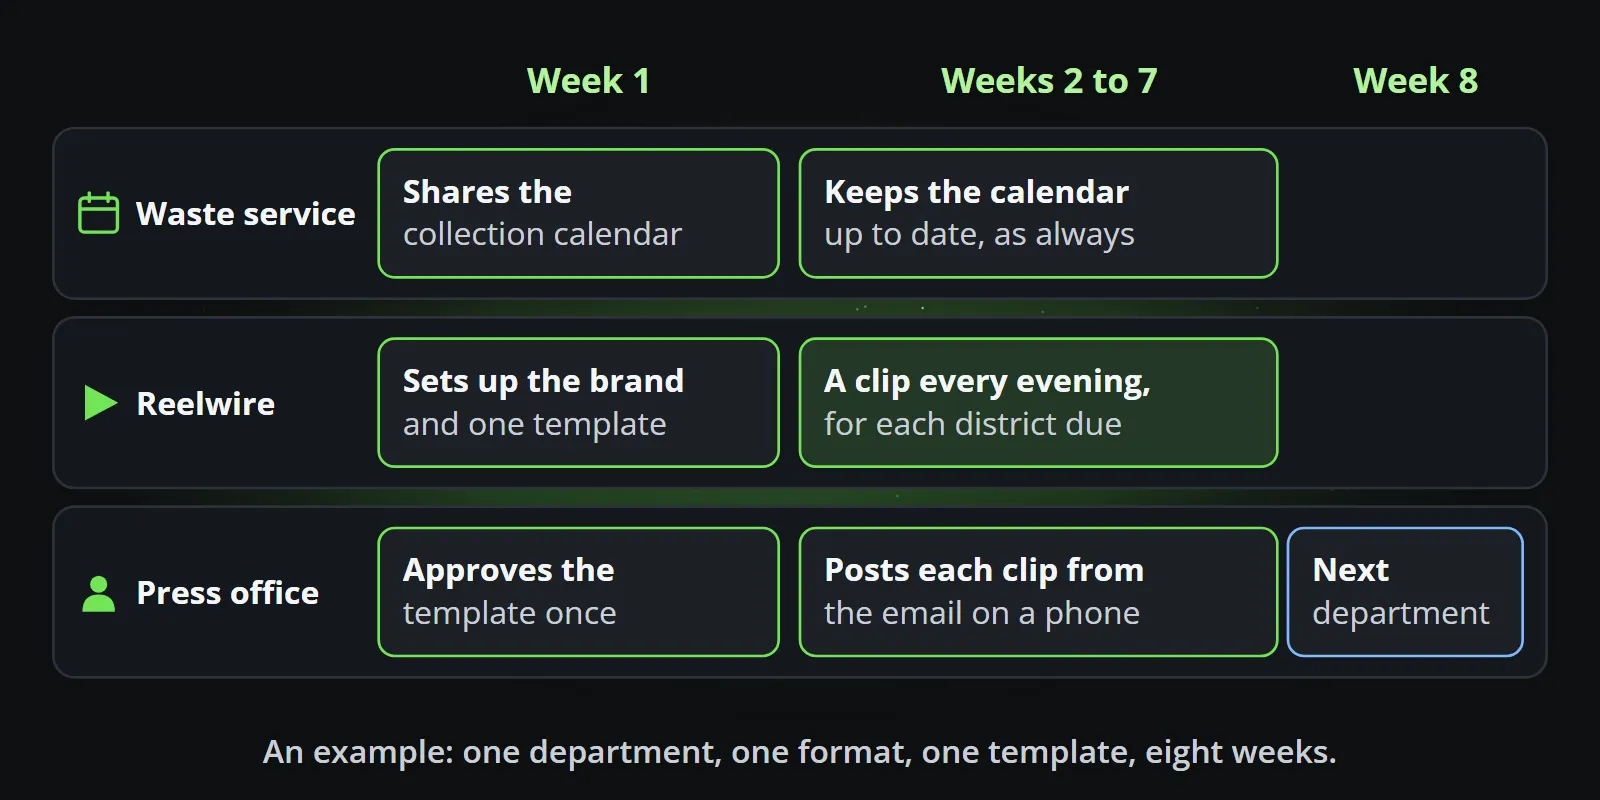
Public bodies rarely start with everything, and they should not. The simplest start is one department, one format and one template:
- Choose the format whose data already exists in a usable form. The collection calendar is the classic: the waste service has it, residents want it, and it repeats every week. A format with a ready-made feed behind it, such as the pollen forecast, the Rhine gauges or the severe weather warnings by state, needs no data work at all.
- Approve the template once. The press office signs off the layout, the wording pattern, the logo and the accessibility a single time, and every clip made from the template looks exactly like what was approved.
- Hand the clips over, do not hand over the accounts. Each finished clip arrives by email with a page to post it from a phone, or by webhook to whatever system the city already posts with. Nobody outside the office needs posting rights on an official account.
- Let it run for six weeks, then choose the next department.
The numbers stay manageable. A daily bin reminder in two shapes, one for Reels and Stories and one for the feed, is about 60 videos a month, which fits Reelwire’s Individual plan of 75 videos for €69 a month; the free plan’s 25 videos a month are enough to test a weekly format first. Each shape is laid out from the same template rather than cropped, as one composition, every aspect ratio explains, and a second language for the residents who read one is a second channel on the same template, with only the words to translate.
Bottom line
A city does not need ideas for content as much as it needs a way to publish what it already knows. The ten formats above are all sitting in a calendar, a register, a gauge or a council system today. Turned into short videos that make themselves, they give a small office a channel that is present every day, useful on a quiet Tuesday and already followed when the storm warning comes.
To try one format with one department, ask about a pilot, read more on Reelwire for public bodies, or start on the free plan, 25 videos a month with no card.
Frequently asked questions
What should a city post on social media every day?
Information residents use that day: weather warnings, which bins go out tomorrow, roadworks and closures, river levels, public transport changes, opening hours, events, council decisions and the city's figures. Most of it already exists as data, so it can be turned into short videos automatically.
Where does the data for municipal social media posts come from?
Mostly from places the city already uses: the national weather service, the waterway and flood services, the waste service's collection calendar, the roads office's closures, the transport operator's timetable data, the council information system and the city's own records.
Can a city repost official weather warnings on its own channels?
In Germany the Deutscher Wetterdienst publishes its warnings as open data. A city can show the warning for its own area with the level, the time window and its own advice, sent from its own system through a custom feed; Reelwire's ready-made feed covers only the severe and extreme warnings for the whole country, by state. The official warning apps remain the alarm. Check the source's conditions of use for how to credit it.
Which posts build an audience for a city account?
The ones worth seeing on a day when nothing is wrong: the pollen forecast, the weekend's events, council decisions in one sentence and the city in numbers. Serving posts such as bin days and closures bring people back; building posts give them a reason to follow.
How can a small communications office post every day?
By letting the data make the routine posts. Each format is one template in the city's look, approved once; the data fills it every day, and the finished clip is handed over by email or webhook for the office to post. People spend their time on the posts that need them.

Co-founder of Reelwire. Every organisation has facts worth showing, its prices, results, releases and warnings, and the vision is that every one of them can show those facts every day, on brand, in every format and language, without a production team behind each post. Your data, in motion: correct, recognisable and consistent from the first clip to the thousandth.